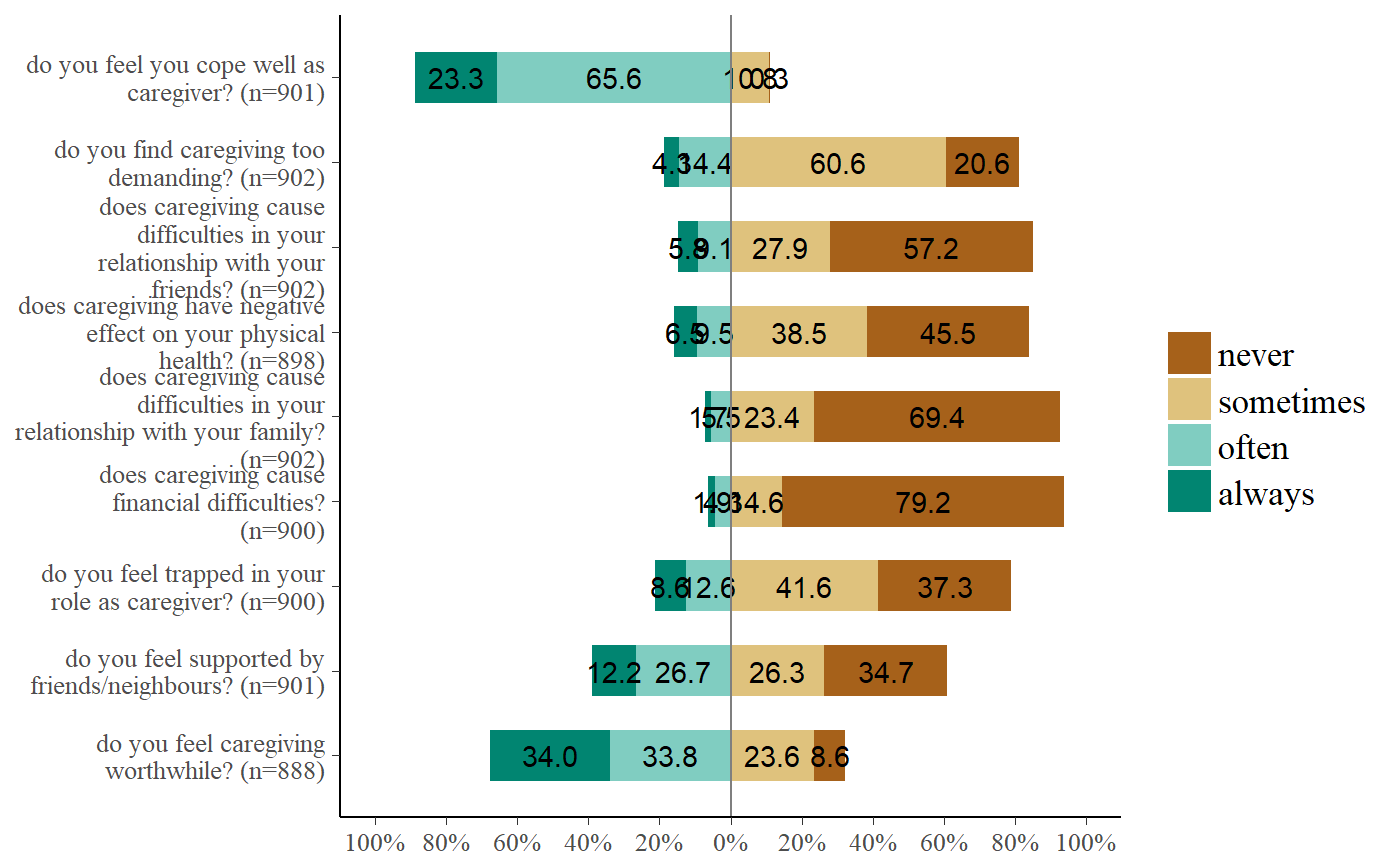
Plot likert scales as centered stacked bars.
sjp.likert(items, title = NULL, legend.title = NULL, legend.labels = NULL,
  axis.titles = NULL, axis.labels = NULL, catcount = NULL,
  cat.neutral = NULL, sort.frq = NULL, weight.by = NULL,
  title.wtd.suffix = NULL, wrap.title = 50, wrap.labels = 30,
  wrap.legend.title = 30, wrap.legend.labels = 28, geom.size = 0.6,
  geom.colors = "BrBG", cat.neutral.color = "grey70",
  intercept.line.color = "grey50", reverse.colors = FALSE,
  values = "show", show.n = TRUE, show.legend = TRUE,
  show.prc.sign = FALSE, grid.range = 1, grid.breaks = 0.2,
  expand.grid = TRUE, digits = 1, coord.flip = TRUE, prnt.plot = TRUE)
Arguments
| items | Data frame, with each column representing one item. |
|---|---|
| title | character vector, used as plot title. Depending on plot type and function,
will be set automatically. If |
| legend.title | character vector, used as title for the plot legend. |
| legend.labels | character vector with labels for the guide/legend. |
| axis.titles | character vector of length one or two, defining the title(s) for the x-axis and y-axis. |
| axis.labels | character vector with labels used as axis labels. Optional argument, since in most cases, axis labels are set automatically. |
| catcount | Optional, amount of categories of |
| cat.neutral | If there's a neutral category (like "don't know" etc.), specify
the index number (value) for this category. Else, set |
| sort.frq | Indicates whether the items of
|
| weight.by | Vector of weights that will be applied to weight all cases.
Must be a vector of same length as the input vector. Default is
|
| title.wtd.suffix | Suffix (as string) for the title, if |
| wrap.title | numeric, determines how many chars of the plot title are displayed in one line and when a line break is inserted. |
| wrap.labels | numeric, determines how many chars of the value, variable or axis labels are displayed in one line and when a line break is inserted. |
| wrap.legend.title | numeric, determines how many chars of the legend's title are displayed in one line and when a line break is inserted. |
| wrap.legend.labels | numeric, determines how many chars of the legend labels are displayed in one line and when a line break is inserted. |
| geom.size | size resp. width of the geoms (bar width, line thickness or point size, depending on plot type and function). Note that bar and bin widths mostly need smaller values than dot sizes. |
| geom.colors | user defined color for geoms. See 'Details' in |
| cat.neutral.color | Color of the neutral category, if plotted (see |
| intercept.line.color | Color of the vertical intercept line that divides positive and negative values. |
| reverse.colors | Logical, if |
| values | Determines style and position of percentage value labels on the bars:
|
| show.n | logical, if |
| show.legend | logical, if |
| show.prc.sign | Logical, if |
| grid.range | Numeric, limits of the x-axis-range, as proportion of 100.
Default is 1, so the x-scale ranges from zero to 100% on
both sides from the center. You can use values beyond 1
(100%) in case bar labels are not printed because they exceed the axis range.
E.g. |
| grid.breaks | numeric; sets the distance between breaks for the axis,
i.e. at every |
| expand.grid | logical, if |
| digits | Numeric, amount of digits after decimal point when rounding estimates and values. |
| coord.flip | logical, if |
| prnt.plot | logical, if |
Value
(Insisibily) returns the ggplot-object with the complete plot (plot) as well as the data frame that
was used for setting up the ggplot-object (df.neg for the negative values,
df.pos for the positive values and df.neutral for the neutral category values).
Note
Note that only even numbers of categories are possible to plot, so the "positive"
and "negative" values can be splitted into two halfs. A neutral category (like "don't know")
can be used, but must be indicated by cat.neutral.
The catcount-argument indicates how many item categories are in the
Likert scale. Normally, this argument can be ignored because the amount of
valid categories is retrieved automatically. However, sometimes (for instance,
if a certain category is missing in all items), auto-detection of the amount
of categories fails. In such cases, specify the amount of categories
with the catcount-argument.
See also
Examples
library(sjmisc) data(efc) # find all variables from COPE-Index, which all have a "cop" in their # variable name, and then plot that subset as likert-plot find_var(efc, pattern = "cop", out = "df") %>% sjp.likert()sjp.likert( find_var(efc, pattern = "cop", out = "df"), grid.range = 1.2, expand.grid = FALSE, values = "sum.outside", show.prc.sign = TRUE )